An ML system can have a perfectly respectable monitoring dashboard and still be difficult to operate.
Imagine a churn score suddenly shifts, a batch prediction job starts producing fewer outputs, or an online endpoint begins timing out for one customer segment. A graph tells you that something changed. It does not necessarily tell you which release was running, what feature data the model used, whether the request path was degraded, or whether the business outcome changed too.
ML observability starts at that gap.
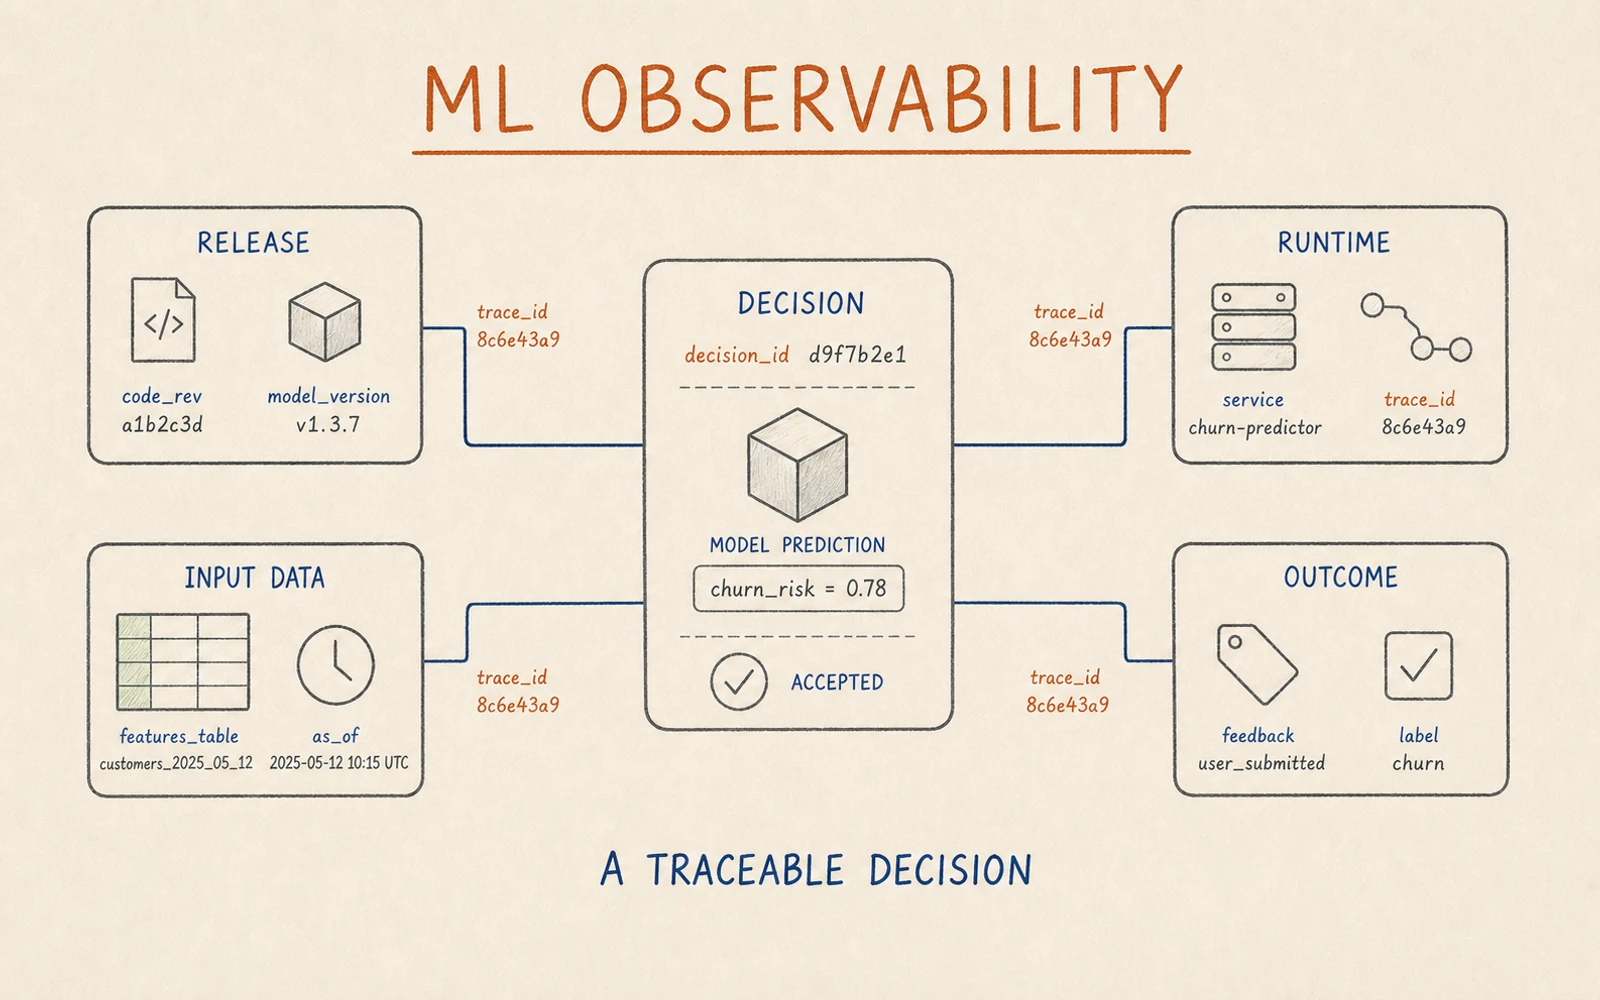
ML observability is the ability to explain a production decision with evidence that joins the release, input data, runtime behavior, prediction and eventual outcome. It treats model monitoring as one evidence layer alongside the rest of the decision path.
If you need the smallest useful starting point, read Minimal viable ML observability: what to monitor first. The next step is making those signals explainable and operational when the system is already doing real work.
What machine learning observability means in production
The useful unit of observation is a decision, rather than a dashboard panel.
For an online model, that might be one fraud check, recommendation, eligibility decision or generated classification. For a batch system, it might be one scoring run, one output partition or one published set of decisions. The operating question stays the same:
Can we explain why this result was produced, what it depended on, and what happened after it was used?
That question needs context that can reconstruct a causal path without relying on somebody’s memory. In an operating model, this is the practical scope of MLOps observability: evidence that survives the handoff between data, model, software and operations.
An engineer investigating an incident should be able to move from a suspicious prediction to the model version and code revision that produced it, then to the feature set or source-data window, the runtime trace, and eventually to a delayed label, override or downstream result. If those things live in unrelated systems with no common identifier, the team has monitoring data but not much observability.
Model monitoring is necessary, but it is not enough
Model monitoring answers useful questions. Has input data drifted? Are feature values out of bounds? Are predictions moving away from a baseline? Has measured quality changed after ground truth arrived?
Azure Machine Learning model monitoring covers this layer with signals for data quality, data drift, prediction drift, feature-attribution drift and model performance. It also makes an important operational distinction: automatic collection can help for supported online endpoints, but batch and externally deployed models still need production inference data collected deliberately.
Those signals can show that a model is becoming unsafe to trust. On their own, they rarely identify the cause.
A prediction shift might be caused by a new model version, a feature computation change, a late upstream table, a changed request mix, an application fallback, a threshold update or a genuine change in user behavior. Looking only at the model makes several different failures look identical.
Databricks data quality monitoring does the same on the data platform side. It can profile tables and inference data over time, including freshness, completeness, data distribution, input and prediction changes, and model performance. That evidence still needs to connect to the release path, serving behavior and response process around those tables.
Model monitoring can show that behavior changed. The broader observability question is what changed in the whole decision path and what the team should do next.
Build a traceable decision record before the incident
You do not need to record every raw payload forever. You do need a stable way to join the information that matters.
For a request-driven service, this often starts with a request_id or trace_id. For a batch workload, use a scoring run_id, output partition identifier or similarly stable execution key. Then keep the decision-specific context beside that key: model version, code revision, feature-set version, data as_of time, output, and later feedback when it becomes available.
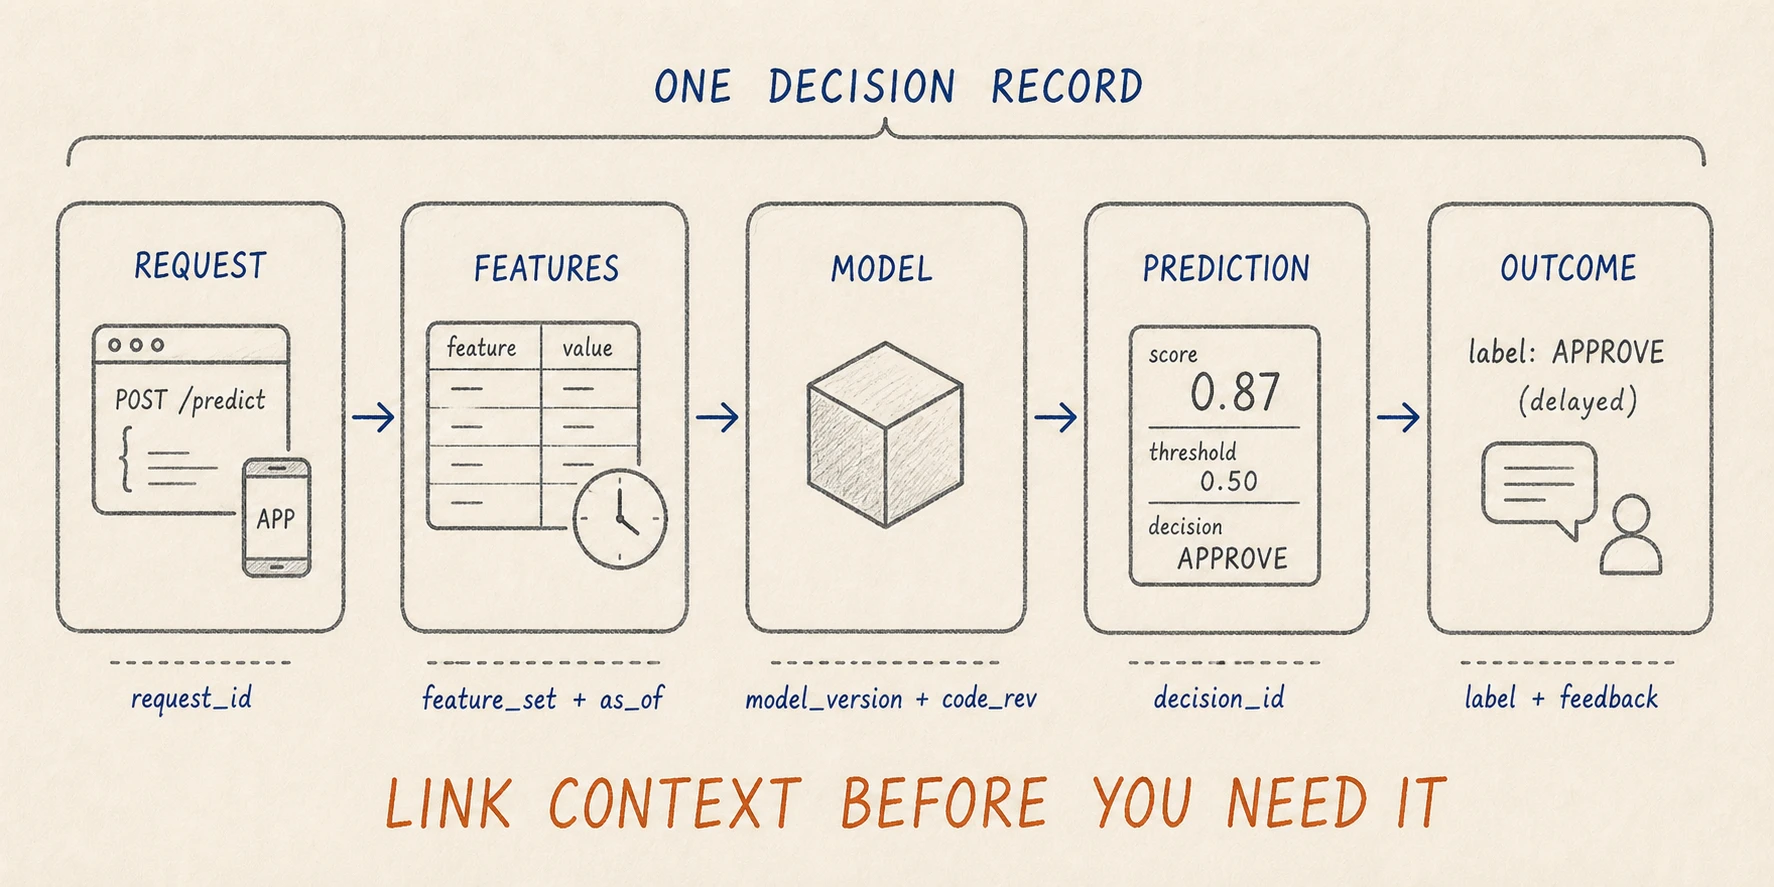
A useful decision record links request or run context, features and their as-of time, the release, the prediction and the later outcome before an incident forces the team to reconstruct them.
The field names are less important than the contract. A record should let a team answer these questions without guesswork:
| When a result looks wrong | Evidence that should be joinable | Why it matters |
|---|---|---|
| Which implementation produced it? | Model version, code revision, deployment target, configuration version | Separates a behavioral change from a release change. |
| What did the model see? | Feature-set version, source snapshot or window, as_of time, key input checks | Makes stale, incomplete or inconsistent inputs visible. |
| Did the request or run behave normally? | Trace or run ID, latency, retries, errors, fallback or degraded state | Distinguishes a model issue from a runtime issue. |
| Was the result useful? | Ground truth, reviewer override, downstream acceptance, user feedback | Connects model behavior to the actual outcome. |
This is close to ordinary distributed-systems observability. OpenTelemetry context propagation is useful because it provides a way to carry context across service boundaries. For ML systems, that context needs a few additional facts: which data and model version participated in the decision, and how the decision was consumed later.
Do not turn this into a mandate to log sensitive features or personal data blindly. Observability records need their own data contract: retain identifiers and evidence that support diagnosis, minimize sensitive payloads, apply access controls, and define retention around the real operational need.
Observe the boundaries around the model
Most difficult ML incidents sit at a boundary, not inside a single model artifact.
The release boundary covers the code, environment, configuration and model artifact that a team actually promoted. The data boundary covers feature availability, schema, freshness, point-in-time behavior and quality. The runtime boundary covers latency, errors, retries, capacity and degraded responses. The outcome boundary covers labels, business acceptance, human override and longer-term effects.
Each boundary needs different evidence and often a different owner. Putting all of it on one ML engineer or one generic dashboard leaves teams with plenty of charts and little accountability.
| Boundary | Practical question | Typical owner | Useful first evidence |
|---|---|---|---|
| Release | What exactly changed? | ML or platform engineering | Code revision, model URI or version, configuration and deployment target |
| Data | Were inputs fit for this decision? | Data and ML engineering | Freshness, schema, feature-set version, quality checks and source window |
| Runtime | Did the system execute the decision correctly? | Application or platform engineering | Request or run trace, latency, errors, retries and degraded responses |
| Outcome | Did the decision help or harm the workflow? | Product, operations and ML | Labels, overrides, downstream acceptance and segment-level feedback |
This is why Why MLOps is mostly an engineering problem treats observability as part of a wider operating model. The model code is only one component. The teams that own data products, deployment paths, endpoints and downstream workflows all contribute evidence that determines whether a prediction can be trusted. The MLOps topic archive follows those same delivery and ownership boundaries across the rest of the production lifecycle.
A signal becomes operational only when it has a response
Monitoring systems make it easy to add metrics. Deciding what a signal should cause is harder.
A freshness alert might mean pause a batch run, continue with an explicitly degraded output, or route the result to review. A prediction-distribution shift might need a data investigation first, not an automatic retraining job. A high endpoint error rate might be an application incident with no model investigation at all.
The decision path needs to be explicit before the alert fires.
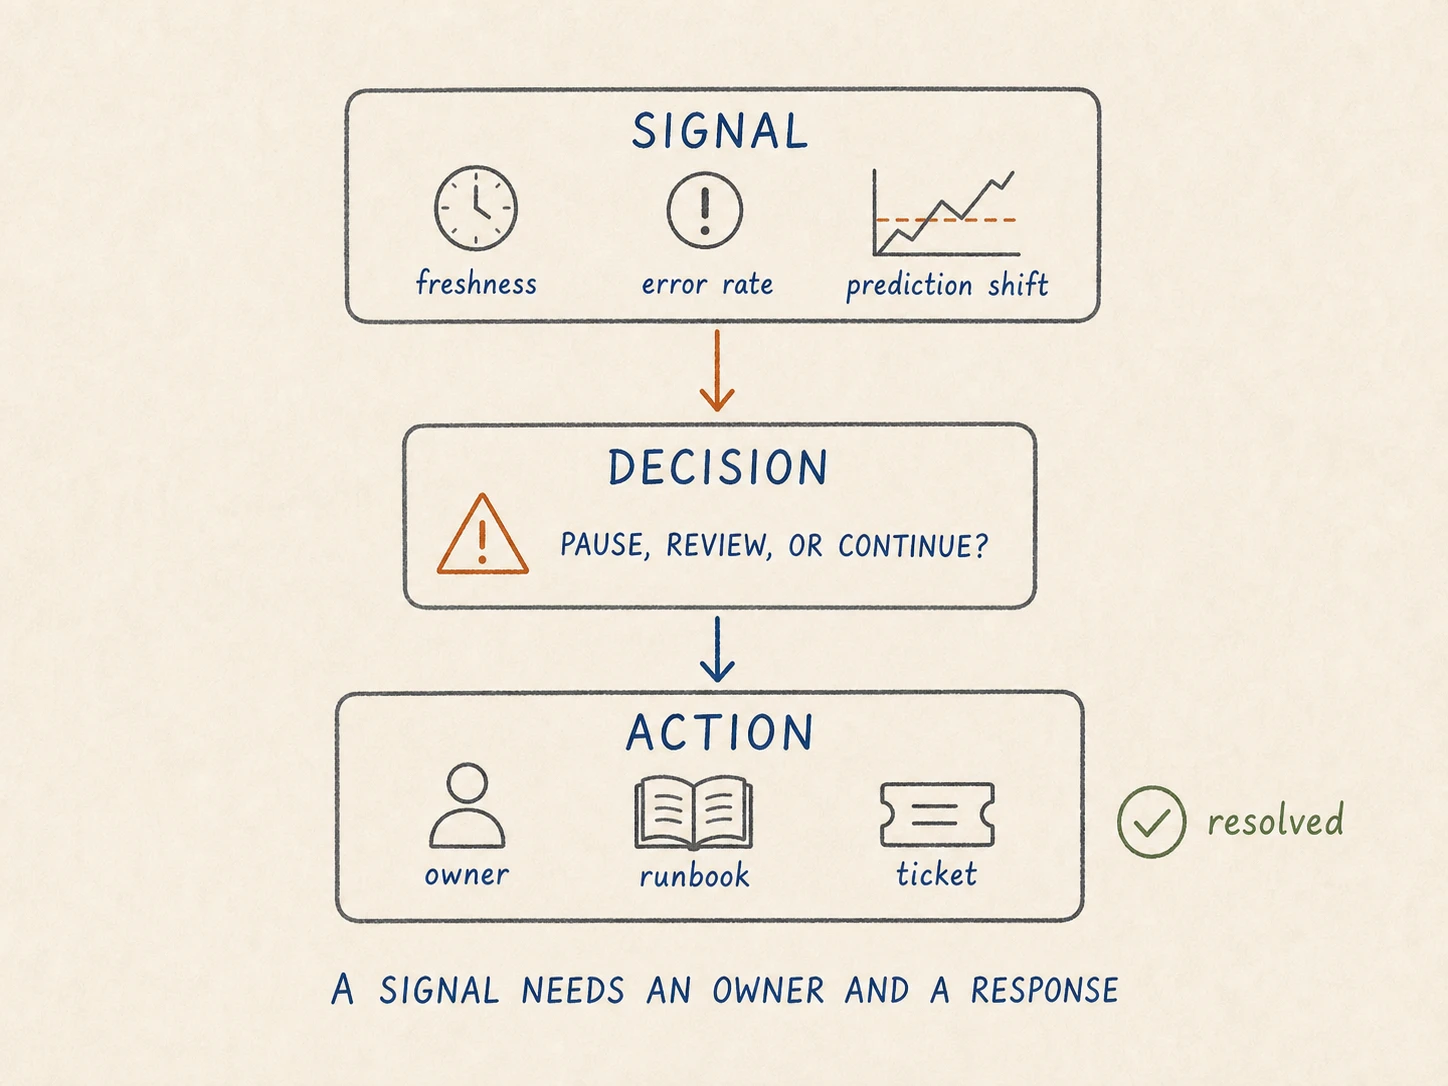
Freshness, runtime and prediction signals become operational when they lead to an owned decision, a runbook and a visible action.
Azure Well-Architected guidance on monitoring workload reliability recommends correlating signals across the workload, checking that critical flows produce valid results, and making alerts drive the right action. A chart can show a pattern. An operational signal must help somebody decide whether to pause, investigate, roll back, route to review or continue.
For services where availability and latency are part of the product promise, use service-level objectives as well. Service level indicators in Azure Monitor show how a baseline target, error budget, burn rate and action group turn service telemetry into a response process. ML-specific signals should follow the same discipline.
Delayed labels do not block useful observability
Teams often wait for ground truth before they take observability seriously. That creates a blind period exactly when a new release or changing input source is most likely to surprise them.
Labels are the strongest evidence of model quality when they exist, but many real workflows get them days or weeks later. Some never receive a clean label at all. You still have earlier signals: data freshness and quality, prediction distributions by meaningful segment, manual-review volume, rejection rates, user overrides, retries and degraded responses.
Those signals do not prove that a model remains accurate. They do tell you when assumptions are changing quickly enough to warrant investigation. The practical baseline in Minimal viable ML observability starts with exactly those earlier signals. The broader observability layer makes them traceable to individual releases, data windows and decisions.
How to grow from monitoring to ML observability
Do not begin by collecting every possible event. Start with one production path that matters: one endpoint, one batch scoring workflow or one downstream decision.
Make its release, data version, runtime execution and output joinable. Add the earliest outcome signal available, then define what the team does when the most meaningful signals cross a threshold. That produces less telemetry than a platform-first rollout and far more usable evidence.
The same discipline helps prevent a dangerous failure mode in AI systems: a runtime can look healthy while it returns a fallback, stale data or misleading success response. AI-generated code risks: when fallbacks and mocks hide production failures shows why traces, API contracts, logs and UI state need to tell the same story.
Pick one suspicious production result and ask whether the team can answer all of these within a reasonable incident window:
- Which release and model version produced it?
- What inputs and feature time did it use?
- Did the request or batch run complete normally?
- Who owns the relevant boundary?
- What happened after the prediction was used?
If the answer depends on searching several dashboards, asking the original author, or hoping that logs have not expired, the system still has an observability gap.
FAQ
What is ML observability?
ML observability is the ability to reconstruct and explain a production ML decision using connected evidence from the release, input data, runtime behavior, prediction and eventual outcome. Model monitoring is part of it, but it is not sufficient on its own.
Is model monitoring the same as ML observability?
No. Model monitoring measures signals such as drift, data quality and delayed performance. ML observability also connects those signals to code and model versions, data snapshots, request or batch context, serving behavior, ownership and the action taken.
What should an ML decision record contain?
At minimum, retain a decision or correlation ID, model and code version, input data or feature-set version with its as-of time, runtime context, output or prediction, and any later label, user feedback or downstream outcome.
Do you need a dedicated platform for ML observability?
Not at the beginning. Start by making the essential evidence joinable and assigning owners to actionable signals. A dedicated platform can help later, but it cannot restore context that the system never recorded.
Further reading
- Azure Machine Learning model monitoring
- Databricks data quality monitoring
- OpenTelemetry context propagation
- Azure Well-Architected: monitoring workload reliability
- Service level indicators in Azure Monitor
- Minimal viable ML observability: what to monitor first
- Why MLOps is mostly an engineering problem
- Observability topic archive