Most teams do not need a full observability platform on day one. They do need enough signal to detect breakage before users or business stakeholders do it for them.
If you ask what to monitor first in machine learning, I would not start with an enormous dashboard. I would start with a small set of signals that answer a more practical question: is the system still healthy, is the data still trustworthy, and are the predictions still plausible enough to deserve continued use?
That is the minimum viable observability layer. It is not glamorous, but it is enough to catch the failures that usually show up first in production ML.
If you want the broader engineering context for why these signals matter after a model leaves the notebook, read Beyond the Notebook: what has to exist before ML can run in production.
What ML observability should mean at the beginning
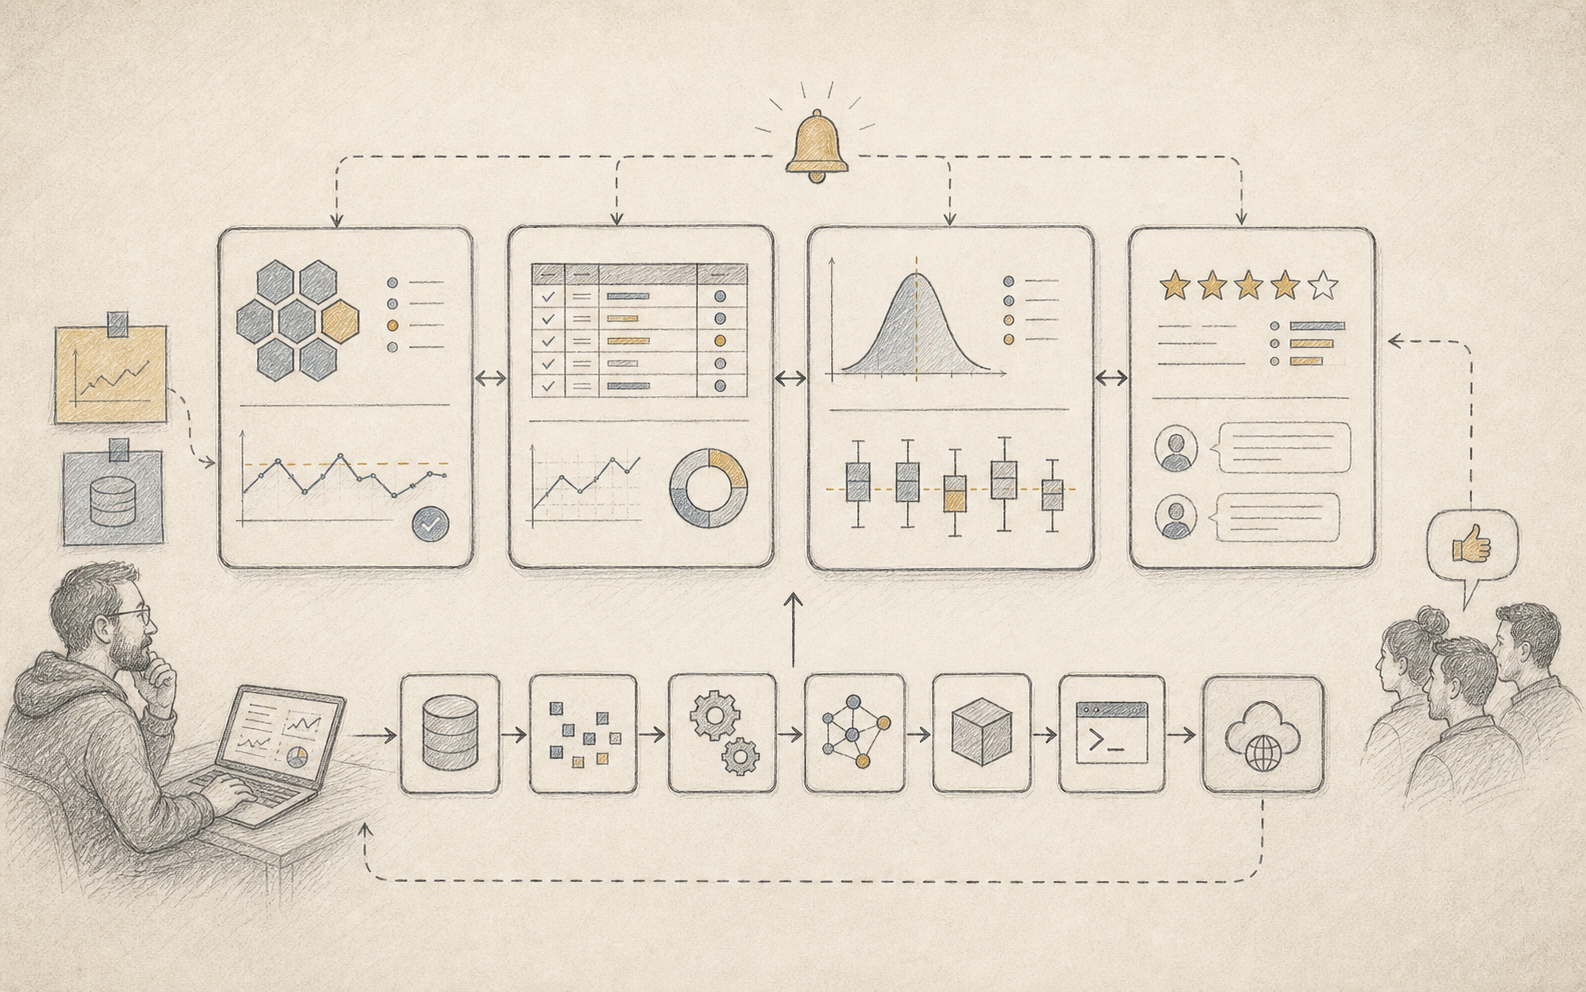
At the start, ML observability should not mean “instrument everything”. It should mean being able to answer four basic questions with reasonable confidence.
First, is the service running as expected? Second, are the inputs still shaped the way the system expects? Third, are the predictions behaving in a way that still looks plausible? Fourth, do we have any feedback from the business side, from reviewers or from downstream systems that suggests the model is becoming less useful?
If you cannot answer those four questions, you are operating mostly on hope.
Start with four signal groups
The smallest useful setup usually covers four groups of signals.
Service health tells you whether the system is available and responsive at all. This is the familiar layer: latency, throughput, error rate, retries and timeout patterns.
Data quality tells you whether the model is receiving inputs it can still interpret safely. At this stage I would watch schema violations, null rates, freshness, row count anomalies and a small set of feature-level distribution checks for the most important inputs.
Prediction behavior tells you whether the outputs still look plausible even when you do not yet have ground-truth labels. Prediction volume by segment, score distribution, class imbalance shifts, confidence patterns or sudden clustering around one output can all reveal trouble early.
Business or human feedback is the last layer and usually the most neglected one. Manual review escalation, downstream rejection rates, user complaints, override frequency or unusual drops in accepted outcomes are often the first signs that the model is no longer useful in context.
What to monitor first in machine learning
If I had to keep it intentionally small, the first dashboard would cover only a few lines:
service latency p95
request error rate
input schema violations
feature freshness for key inputs
prediction volume by segment
prediction distribution drift
manual review escalation count
downstream rejection or override rate
That is enough to begin seeing whether the system is stable, whether the inputs are credible and whether the outputs are starting to behave strangely.
The mistake is not starting small. The mistake is starting with only infrastructure metrics and calling that ML observability.
Labels arrive late, so use earlier signals first
One reason teams postpone observability is that they do not have immediate labels in production. That is common. In many systems the ground truth arrives days or weeks later, and sometimes it never arrives in a clean form.
That is not a reason to wait.
The right move is to begin with earlier signals: freshness, schema stability, prediction distribution, business workflow anomalies and human-review patterns. Those are not perfect substitutes for labels, but they are far better than waiting in operational darkness.
What not to monitor first
A lot of observability work becomes bloated because teams try to measure everything at once.
I would avoid three traps early.
Do not begin with dozens of drift metrics for every feature in the pipeline. Start with the features that matter most to the prediction path.
Do not start by building a giant custom observability framework if the team does not yet know which alerts would trigger action.
And do not confuse explainability dashboards with observability. Explanations can be useful, but they do not replace runtime visibility into data, behavior and outcomes.
A minimal bar for actionable alerts
The point of observability is not only to visualize. It is to trigger action before users discover the problem for you.
That means every alert should imply a likely owner and a likely next step. If feature freshness drops, the response probably belongs to the data side. If prediction distribution shifts sharply, the response may begin with data inspection or segment-level analysis. If manual review or downstream rejection spikes, the conversation probably moves closer to the product or business workflow.
If no one knows what an alert should cause, then the alert is not yet operational.
A practical definition of “enough” for the first version
The first version is good enough when a team can answer three questions without guesswork.
- Can we tell when the service is unhealthy?
- Can we tell when the inputs are no longer trustworthy?
- Can we tell when the outputs start looking suspicious even before full business feedback arrives?
If the answer is yes, you already have a real observability baseline.