MorrowBasket Retail, our fictional retailer with shops and an online store, has found the late return behind its changing Friday report. Now the sales manager compares that report with the finance team’s spreadsheet. The totals still disagree. Sales is looking at the amount before returns, while finance has already subtracted them. Both teams retrieved the data correctly.
The first article in this series introduced their different data needs. This time, the team needs to agree on what its sales figures mean and build a repeatable way to produce them.
In this article, we’ll explore data warehouse architecture through MorrowBasket Retail’s sales reports and forecasts, continuing our series on how different data platforms may support analytics and AI.
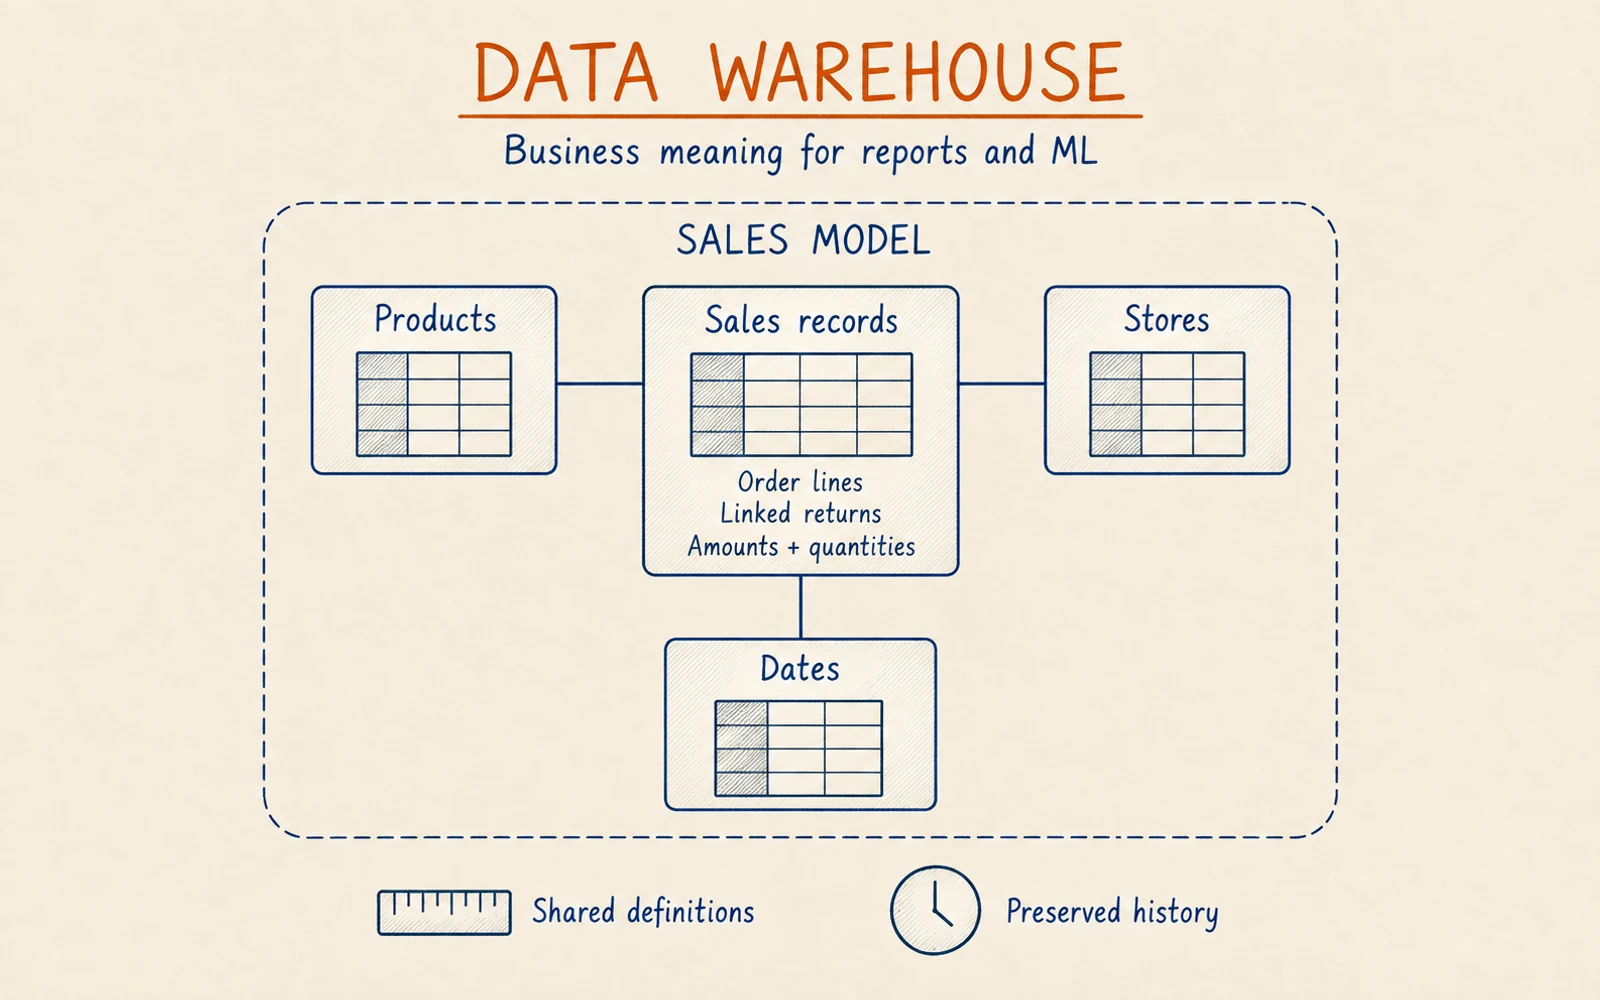
MorrowBasket connects sales records with products, stores and dates so reports and model inputs can use the same business context.
What is a data warehouse?
A data warehouse is a data store organized for analysis, with prepared records that people and applications can query using consistent definitions. Teams load data from source systems, reconcile it and retain the history needed for their analytical questions. Its architecture includes how that data arrives, how it is prepared and how consumers receive it.
For MorrowBasket, this could mean bringing orders and returns together so the sales manager and finance team can read the same clearly named measures. They can still choose different measures. Sales before returns and sales after returns are both useful, provided everyone knows which number they are reading.
Inside the warehouse, MorrowBasket’s sales table might have a purchase date, numeric quantities and amounts, and identifiers connecting each sale to its product and store. These columns and their data types form the table’s schema. Analysts and reporting tools typically query those tables using SQL, a language for selecting records, joining tables and calculating totals.
Engineers keep those tables up to date through a data pipeline, a repeatable sequence of loading and preparation steps. For MorrowBasket, a run might read new orders and changed returns, standardize product identifiers and update the prepared sales tables. If it runs nightly, the report reflects the last successful refresh, while a new return will appear after a later run processes it.
The way the engine stores data can also help with analysis. To total units sold by product, MorrowBasket needs a few columns across many purchases. With columnar storage, values from the same column are stored together, so the engine can read the required columns and skip unrelated ones. Microsoft SQL columnstore documentation explains how this reduces data reads and allows compression. It is one technique for making large analytical queries more efficient.
MorrowBasket’s team still has to decide which orders count, how returns affect a period and when a result is ready to use. Engineers then implement those business rules in maintained tables and calculations.
A report can summarize those tables, and a forecasting job can prepare model inputs from them. The shared work is identifying the same purchases, products and events. Each consumer can then use that information at the level of detail and historical cutoff it needs.
Why does MorrowBasket need more than its order database?
When a customer places an order, the application needs to record the purchase and update its status reliably. A support employee might look up one order to check whether it shipped. The application database is built around that work.
The sales manager’s question reaches further. They want to compare sales after returns across shops and the online store, grouped by product and week. The answer may require orders from one system, returns from another and product descriptions maintained elsewhere. Those systems may even use different identifiers for the same product.
Engineers can write queries against the application database, and for a small workload that may be enough. As the questions grow, repeated scans of historical orders can compete with the application’s normal work. Separate analytical processing gives the team a place to combine sources and run those queries without making every report depend on the live ordering system.
History creates another reason for separation. The application may keep the latest order status because that is what its users need. An analyst may need to know what changed, and the forecasting team may need to reconstruct inputs from before that change. Copying today’s status into another database does not recover an earlier value that was never retained.
MorrowBasket should start with the questions its existing arrangement cannot answer reliably. A few reporting views and a scheduled preparation job remain a reasonable starting point. A warehouse becomes useful when the team needs to maintain shared analytical data beyond those boundaries.
How do orders become a consistent sales history?
Let’s follow one purchase. On Friday, a customer buys two units of a product at €50 each. The order line records a quantity of two and an amount of €100. The customer requests a return of one unit that day, but the data platform receives that request on Monday.
For this simplified example, MorrowBasket counts the requested return as a €50 deduction and assigns it to the original sale date. Friday’s corrected sales after returns therefore become €50. These are illustrative reporting rules: taxes, discounts, currency conversion and the later refund process are outside this example.
Decide what one row represents
Before combining anything, the team needs to choose what each row means. An order can contain several products, and a customer can return only part of a purchase. Keeping one row per order line lets MorrowBasket connect a returned product and quantity to the purchase it came from.
Engineers call this level of detail the grain. In our example, fact_order_lines has one business record per order line, while fact_return_lines has one per return line. A daily sales table has a different grain: one row per reporting date, store and product.
A fact table holds measurements about events, such as quantities and amounts. Dimension tables describe the products, stores or dates used to group those measurements. Microsoft Fabric guidance on fact tables uses sales order lines as an example of transaction-level facts. Keeping that detail allows the team to investigate a daily total without guessing how it was assembled.
MorrowBasket should retain the source system and the original order and line identifiers. If two source systems both issue order number 104, the source identifier distinguishes them. A return needs its own identity and a reference to the original order line. A product name alone is too ambiguous to establish that relationship.
Apply the return once
Suppose Monday’s loading job fails after receiving the return and then retries. The second delivery represents the same business return. Subtracting €50 again would incorrectly reduce the sale to zero.
The preparation process must recognize a repeated source record and avoid counting it twice. This property is called idempotency: processing the same input again leaves the business result unchanged. If the source later corrects that return, the team needs to recognize the new version while preserving the earlier one where history is required.
Joining the tables also requires care. If one order line has several return records, joining them directly repeats the order amount on every matching row. Summing those rows inflates sales. For a report at order-line level, the team can first total the valid returns for each original line, then combine that result with the order line once. The detailed return records remain available for investigation.
Publish a result the team can explain
Before publishing Friday’s correction, MorrowBasket checks that the return points to a known purchase and that its quantity and amount satisfy the agreed rules. For this pipeline, I would hold unmatched returns for investigation and flag the affected output as incomplete. Silently dropping them would leave a plausible but overstated sales figure.
Once the records pass those checks, the job recalculates the affected reporting date, store and product. It should also record which source versions and preparation logic produced the result. Microsoft Fabric loading guidance recommends logging each processing run, its status, errors and inserted, updated or deleted row counts. Those records help the team distinguish a business correction from a failed load.
Sales and finance must also agree on the calendar used for daily reporting and label when a report was refreshed. A shared definition can still produce different visible totals if one team reads Monday’s refresh and another reads Friday’s export.
As you can see, resolving the original disagreement takes several explicit decisions. MorrowBasket now has named measures, identifiable records and a repeatable correction process. The medallion architecture guide explores how to organize these preparation responsibilities as data moves from source records to published outputs.
MorrowBasket could also retain the original order and return files in a data lake, then publish prepared tables in the warehouse. That optional step gives engineers source files to revisit, but the team must keep warehouse outputs in sync when those files change.
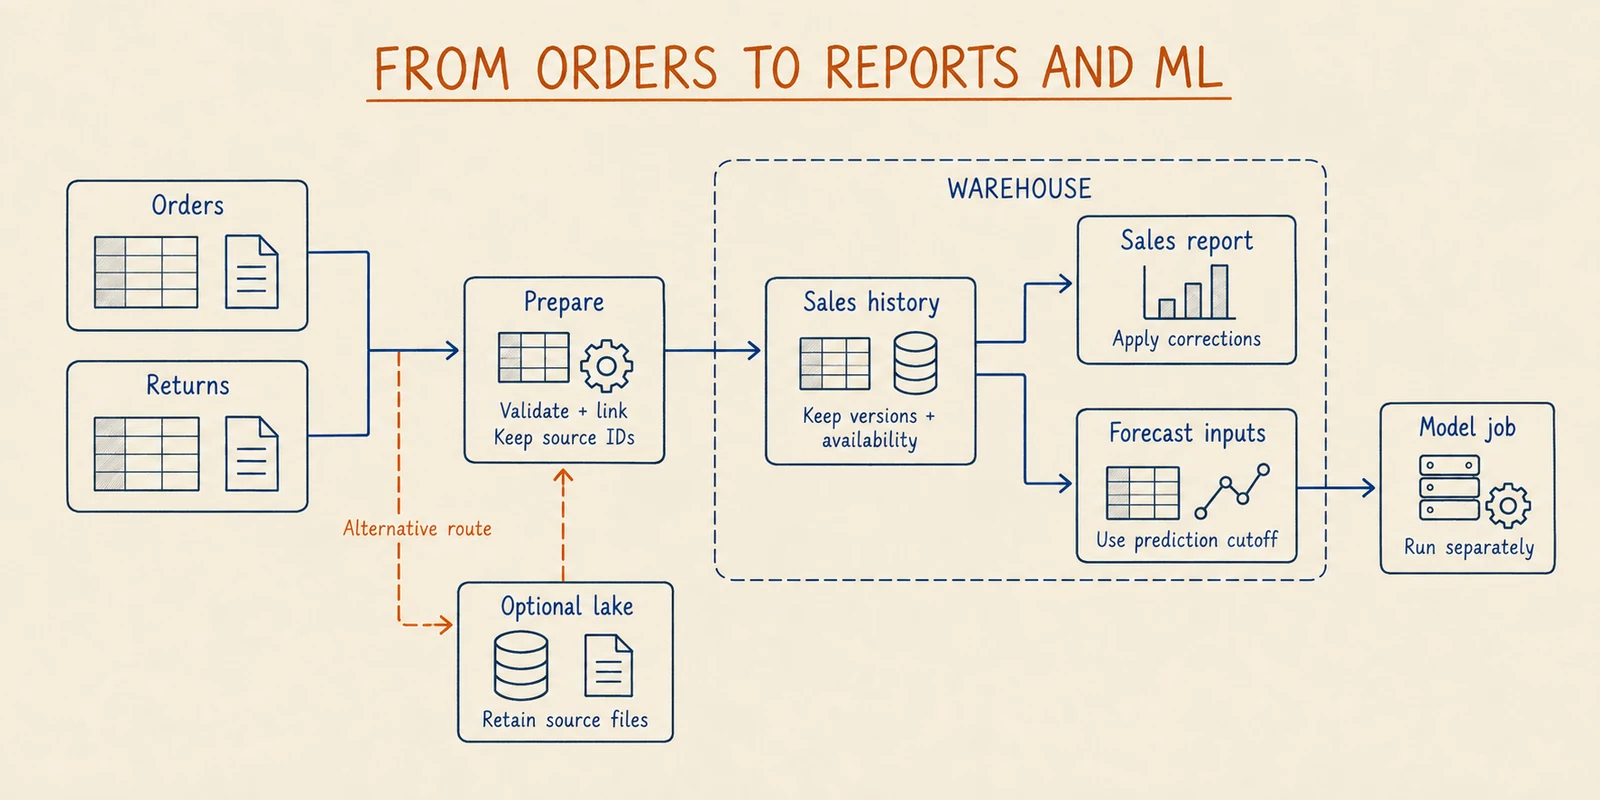
One possible MorrowBasket flow. The lake is an alternative ingestion route, while reporting corrections and forecast cutoffs remain explicit preparation responsibilities. The model runs outside the warehouse in this example.
How can the warehouse support MorrowBasket’s forecast?
The data scientist can now work with identified purchases and returns instead of reconciling source systems again. A daily job might prepare one row per product, store and prediction date, with input values such as recent units ordered and returns known at that time. These input values are called features.
The team still has to define what it wants to predict. A monetary sales report and a forecast of next week’s units answer different questions. A returned unit does not automatically cancel a unit of future demand. MorrowBasket can keep ordered quantities and returned quantities separate, then decide how to use them when evaluating its forecast.
Warehouse transformations can calculate the agreed inputs using SQL. A scheduled job can read the result and run model training or batch prediction elsewhere. The team can use the same maintained preparation logic across those jobs, while retaining the cutoff and source versions associated with each run.
Keep the history the prediction actually used
Let’s return to Friday evening. The prediction pipeline knew about the €100 purchase. It could not use the return that arrived on Monday. Rebuilding Friday’s inputs from the corrected €50 sales figure would give the model information unavailable at the time.
MorrowBasket needs to preserve both the business event time and when each version became usable by the prediction pipeline. Arrival in a source system, loading into the warehouse and availability to the model can happen at different times. A single last_updated value on an overwritten row cannot reconstruct those earlier states.
For this workload, I would retain the relevant source changes with their availability history and save the prepared input snapshot for each prediction run. The snapshot records what the model actually received. The retained changes support rebuilding other historical datasets under an explicitly chosen cutoff. Saving only today’s corrected table would provide neither capability.
Microsoft’s point-in-time retrieval documentation explains selecting feature values within a historical time window. The source-delay example in A01 shows why an assumed delay cannot replace an unrecorded availability history.
If the team discovers that an evaluation included Monday’s correction, it must rebuild the affected inputs and rerun the evaluation before using that result to choose a model. Later information can still establish the outcome the model was meant to predict. The restriction here concerns information supplied as inputs at prediction time.
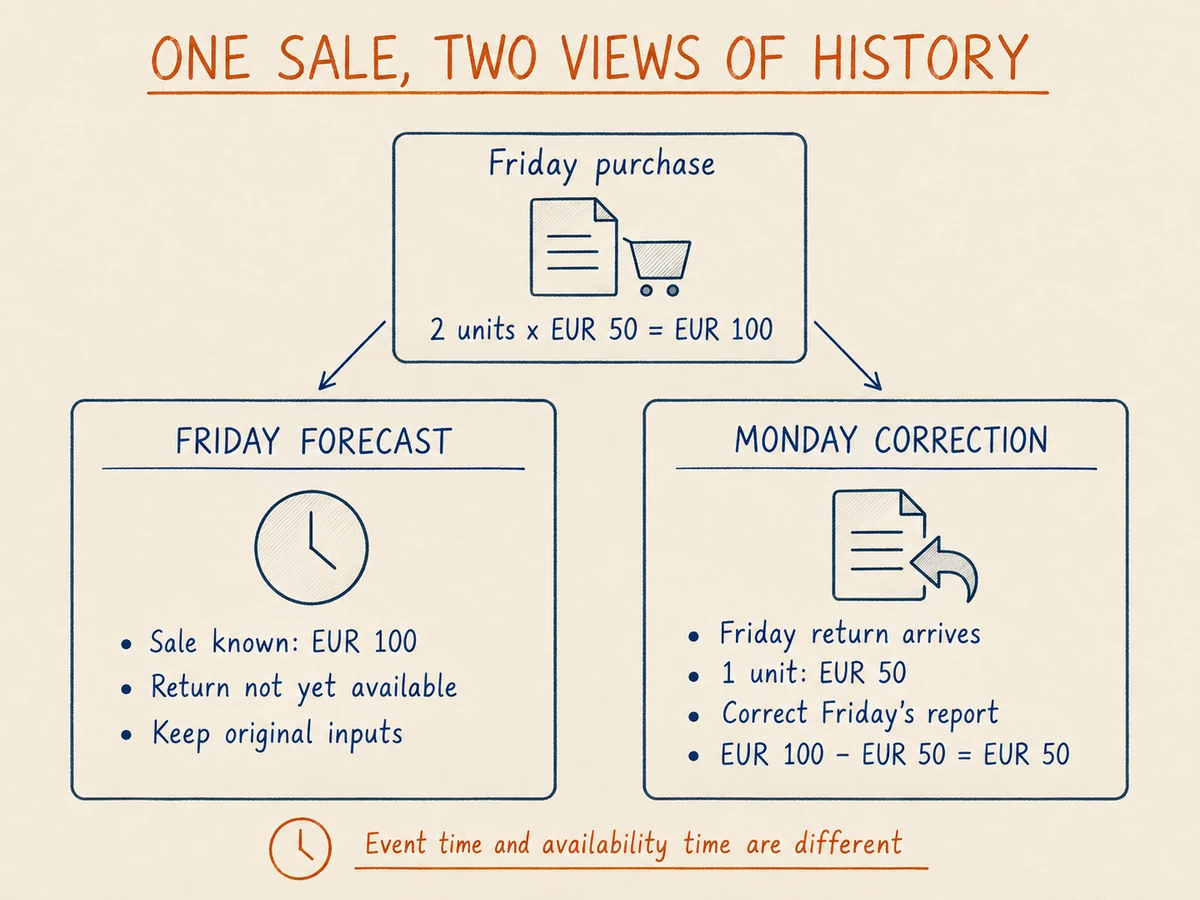
The amounts illustrate the sales information available at different times, not the forecast’s target. MorrowBasket keeps the corrected report and the original prediction inputs for different purposes.
This is enough to build a warehouse-based ML workflow without introducing a feature store immediately. The feature store alternatives guide goes deeper into when maintained tables and shared transformation logic are sufficient. Model quality still needs evaluation, because a well-prepared input table cannot establish whether the forecast is useful.
What does the assistant still need?
While finance reviews the corrected report, a support employee asks whether the customer can return the remaining unit. The assistant may need the purchase date, product and quantity already returned. The warehouse could supply that context through an application interface, provided its freshness is suitable for the question.
A nightly copy may be too old to confirm whether another return was accepted a few minutes ago. That question may require a current lookup in the order or returns system. The team must decide which source can answer it reliably.
The assistant also needs the policy that applies to this purchase. The newest document may contain rules introduced after the customer bought the product. Prepared sales tables do not automatically select that policy or preserve the document versions needed to find it.
Access matters on both sides. Before using purchase details or policy text, the application must check whether the employee may read them. An account with broad warehouse access does not establish what every employee should see. The same restrictions need to reach any derived search records used by the assistant.
MorrowBasket also needs to distinguish answering a question from approving a return. An assistant that changes an order needs an authorized application operation and the relevant business checks. Access to analytical data alone does not grant permission to perform that action.
When is a warehouse enough?
MorrowBasket’s immediate needs may be covered by maintained sales and returns tables, the history required to reproduce inputs, and a daily preparation job. Sales and finance can read clearly named measures. The forecasting team can use a documented input dataset with a known cutoff. An owner can investigate an incomplete load and repair the affected results.
Before adding another component, the team should identify the unmet requirement. Perhaps new document formats need a separate retrieval service. Perhaps the forecast must run more frequently than the existing preparation allows. Those are concrete reasons to revisit the design. Wanting to use AI is too broad to identify what needs changing.
A useful review is to take Friday’s corrected sales figure and trace it back to the order line and return. Check the calculation, when each record became available, which run published the result and who can repair it. Then inspect the saved inputs from Friday’s forecast and verify that Monday’s return is absent. If the team can do both, it has evidence that its warehouse supports these two uses correctly.
FAQ
How is a data warehouse different from an application database?
An application database supports work such as accepting orders and updating deliveries. A data warehouse prepares data for analysis across records, periods and sources. At MorrowBasket, that means combining orders and returns under documented reporting rules while keeping the history its consumers need.
Can a data warehouse support machine learning?
Yes. MorrowBasket can prepare daily model inputs from warehouse tables and run training or prediction in a separate job. It still needs reproducible transformations, a history of when data became available, and model evaluation. Adding a feature store should address a specific requirement that this arrangement cannot meet.
Further reading
- Microsoft Fabric: modelling fact tables: grain, measures and the role of transaction-level records.
- Microsoft Fabric: loading a dimensional model: preparation, historical changes and logging processing runs.
- Azure Machine Learning: point-in-time retrieval: historical feature selection and the assumptions behind source delay.
- Microsoft SQL: columnstore query performance: how reading selected columns and compressing their values supports analytical queries.